01 COMPANY / CONTRACT
From the company
to the contract.
Company quotes, price charts, news and available fundamentals connect with option chains, contract comparisons, flow and modeled exposure.
QUOTESCHAINSFLOW
STOCK & OPTIONS RESEARCH
Company to contract.
The research belongs together.
Dedicated analysis engines, detailed options research, market positioning and company intelligence in one focused workspace, on desktop and iPhone. Built for people doing their own research and making their own decisions.
A live walkthrough of the working app, arranged by email. No account or payment needed.
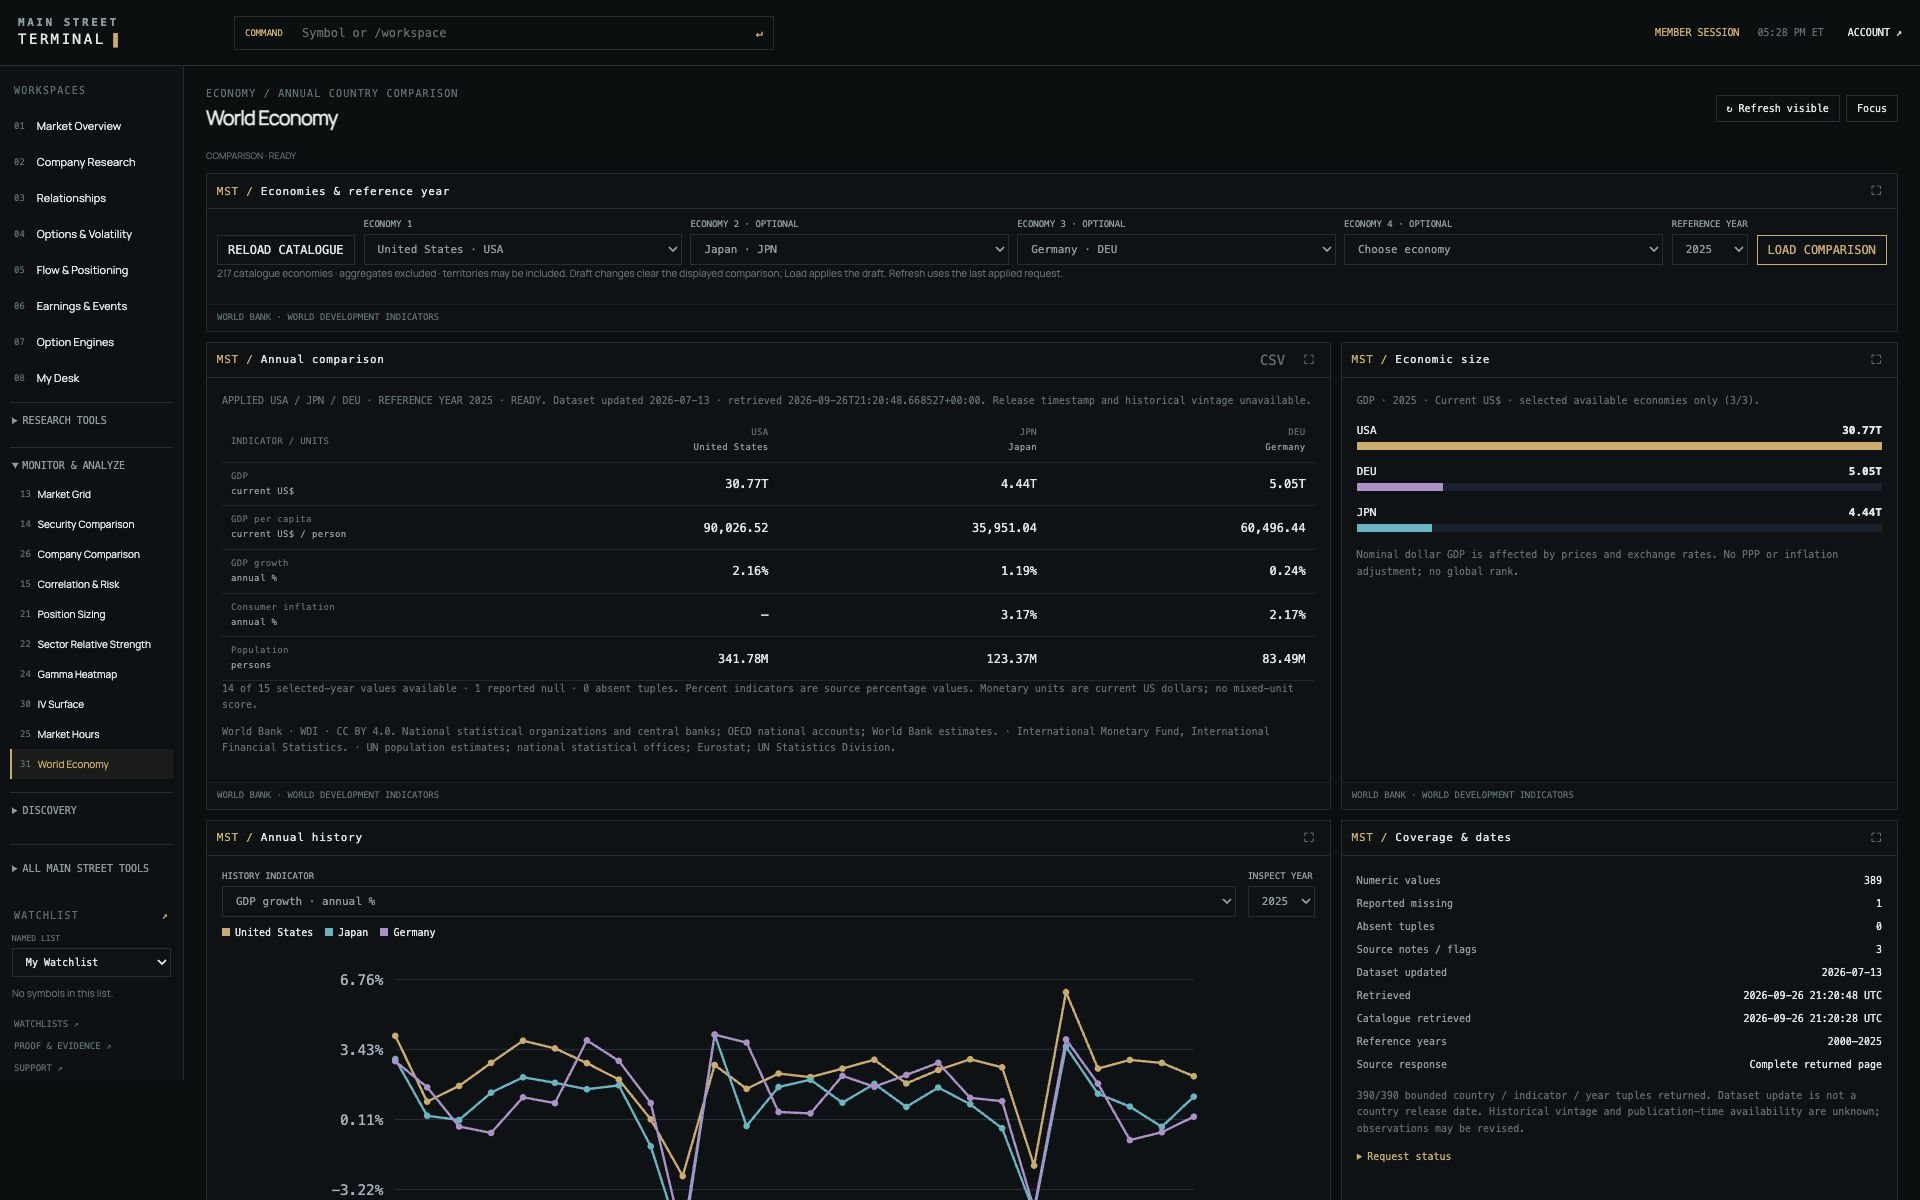
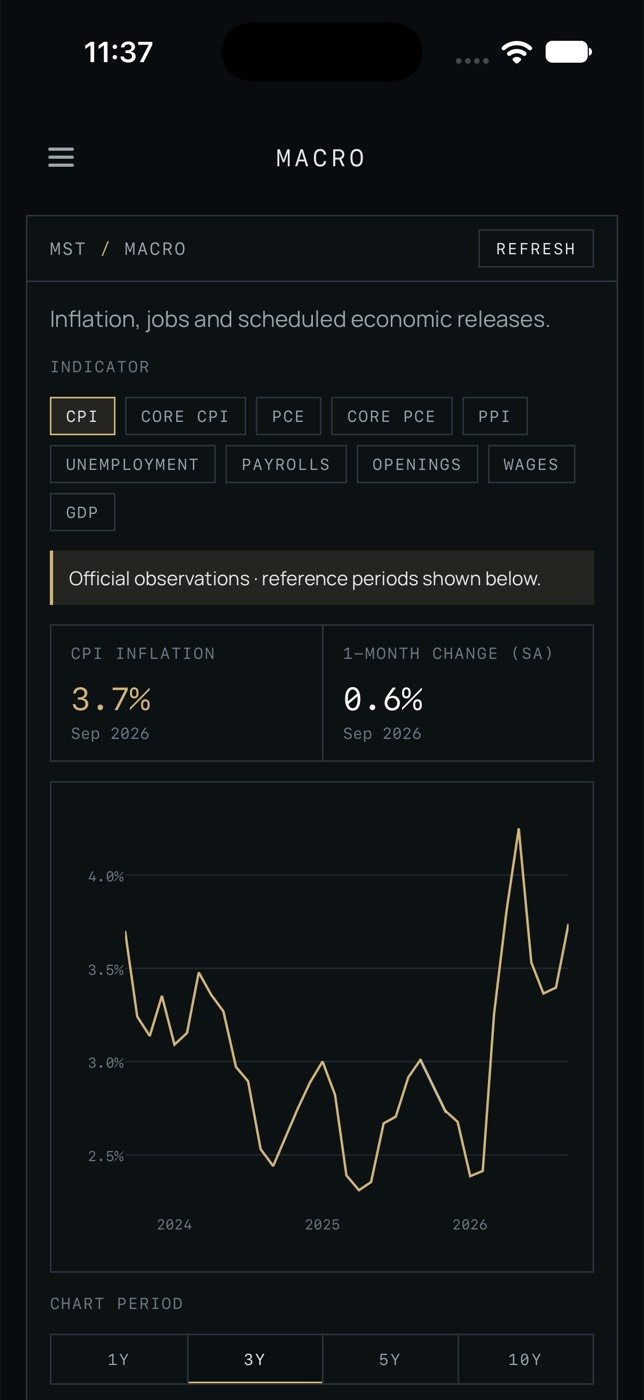
01 / REAL SCREENS
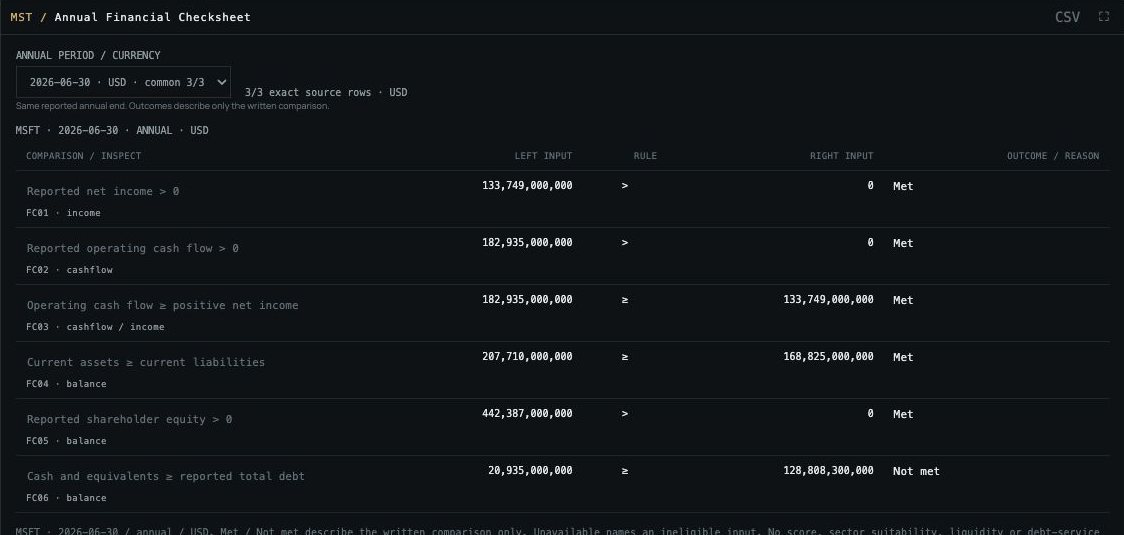
Main Street Terminal on desktop and iPhone: financial statements, options chains, filings and economic data in one workspace. Captions name the data sources shown.
Enter a ticker, choose an engine and run it. Events, macro releases, quotes and chains sit a tap away.
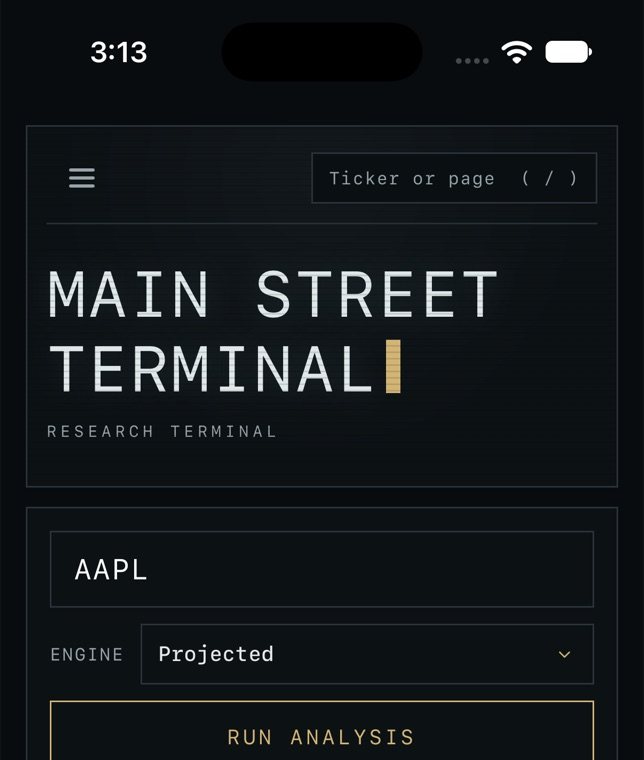
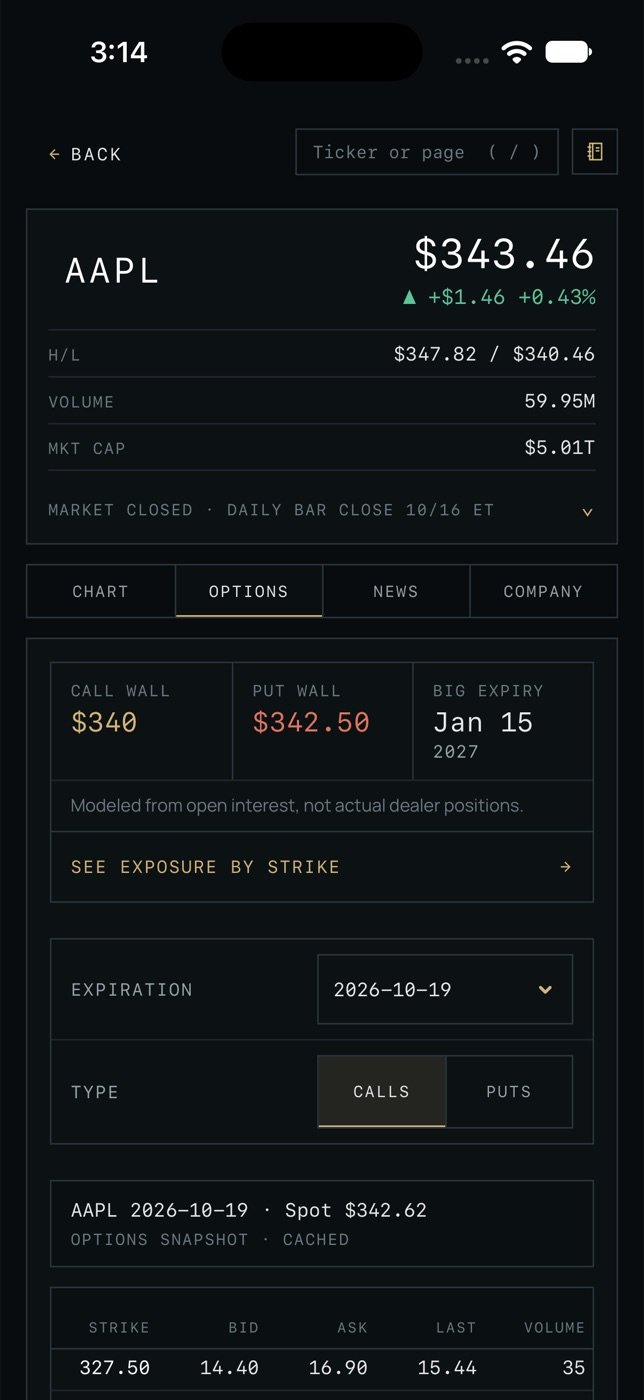
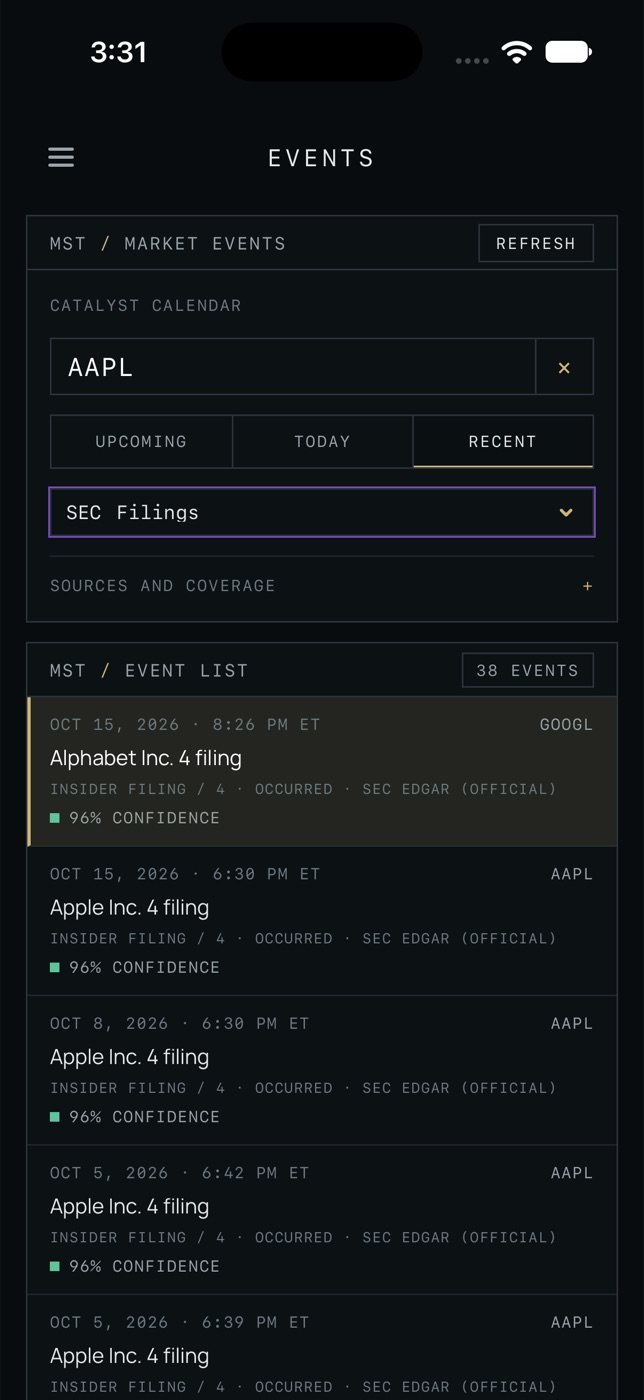
Layouts and data coverage may change. Sources: World Bank WDI (CC BY 4.0); U.S. Bureau of Labor Statistics; SEC EDGAR; licensed market data.
02 / THE WORKSPACE
A question rarely stops at one view. Follow it from the business to the instrument, through the event and into the wider market.
Company quotes, price charts, news and available fundamentals connect with option chains, contract comparisons, flow and modeled exposure.
Earnings calendars and historical reactions sit alongside public-source event records. Dedicated engines organize event-related contract research.
Brief, Markets, Macro and Bonds & Fed add context. Watchlists and saved setups keep the research available as the questions change.
Modeled exposure is descriptive, not actual dealer holdings or a price prediction.
THE APPROACH / STRATEGY RESEARCH
From equity behavior to volatility pricing and the wider market. Explore the questions behind established strategy families—and the assumptions that need testing.
Compare the movement priced into options with the movement that subsequently occurs. Any strategy must account for option premiums, hedging costs and losses during large moves.
A RESEARCH LANDSCAPE, NOT A LIST OF IMPLEMENTED STRATEGIES. Our engines have not established an investment edge. Gold indicates the selected topic.
03 / INTERACTIVE RESEARCH STUDY
Watch a mean-reversion algorithm make decisions on a synthetic price path. Every trade follows a rule. Every result includes modeled costs.
Enable JavaScript to explore this synthetic session.
A price far below its recent average might recover. The algorithm measures that distance in standard deviations using the previous 30 one-minute observations. The glowing field shows the history behind that reference.
Buy one unit when the z-score falls below −1.5. Exit on a return to the mean, a 1% loss from entry, or 30 minutes held. Decisions fill at the next observation; any remaining position closes at session end.
A falling price can keep falling. Each fill costs 0.05% of its value, representing simplified fees and slippage. Net results include open-position gains and losses. Stops can fill beyond their threshold; losses remain visible.
391 seeded synthetic prices, starting at $100; a 30-observation warm-up; one unit maximum; no leverage or shorting. Trailing population standard deviation excludes the current observation. No new entries in the final two observations. Fills use the following price plus a 0.05% cost; the scheduled closing liquidation uses the final price. This model omits liquidity constraints, market impact and taxes. P&L is in dollars, not a portfolio return or benchmark comparison. Particles show historical observations, not orders; diamond markers show fills.
The trade record appears as the session unfolds.
An implemented educational algorithm running on synthetic data—not an MST engine, market backtest or evidence of an investment edge. Parameters are illustrative. No claim of profitability or market outperformance.
Main Street Terminal is research software. It does not execute trades, hold funds, manage portfolios or provide personalized investment recommendations.
04 / ACCESS
Personal demos are open now. Public sign-up and purchase are not available yet.
Both links open an email to [email protected]. Website privacy explains how correspondence is handled. Please do not send passwords or account numbers.